1.7 Interface Walkthrough
λ is composed of two parts: a webserver and a Snap! interface with autograding capabilities. In the current implementation, only instructors need to use the webserver, though in the future there may be functionality added for students. (See the future work section.)
1.7.1 Web Application
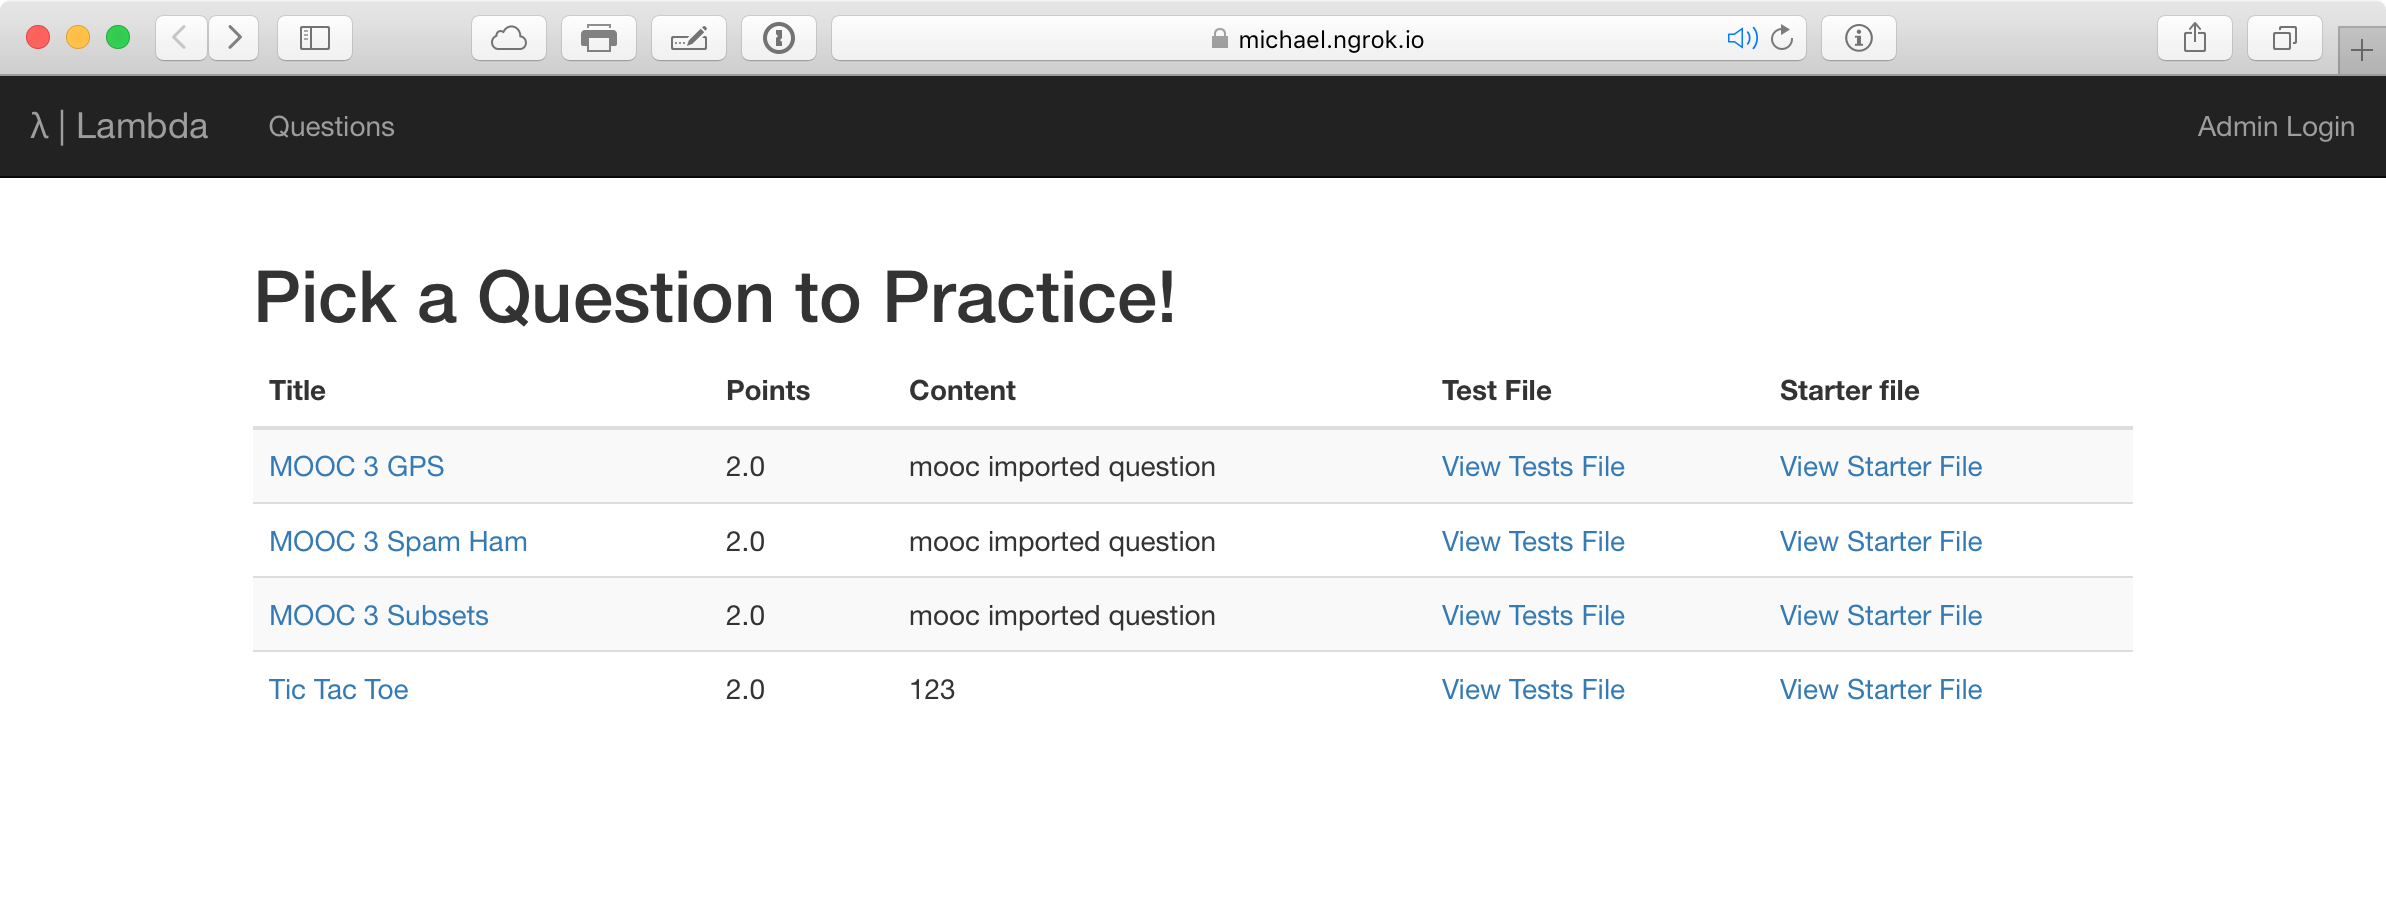
The basic web interface (figure 4) presents a list of problems to try. This list is public, so anyone can attempt any problem, but instructors are expected to embed specific questions with their directions. Users can click on a link to work on a particular question.
The rest of the interface options come after the user has logged in with an admin account (figure 5).
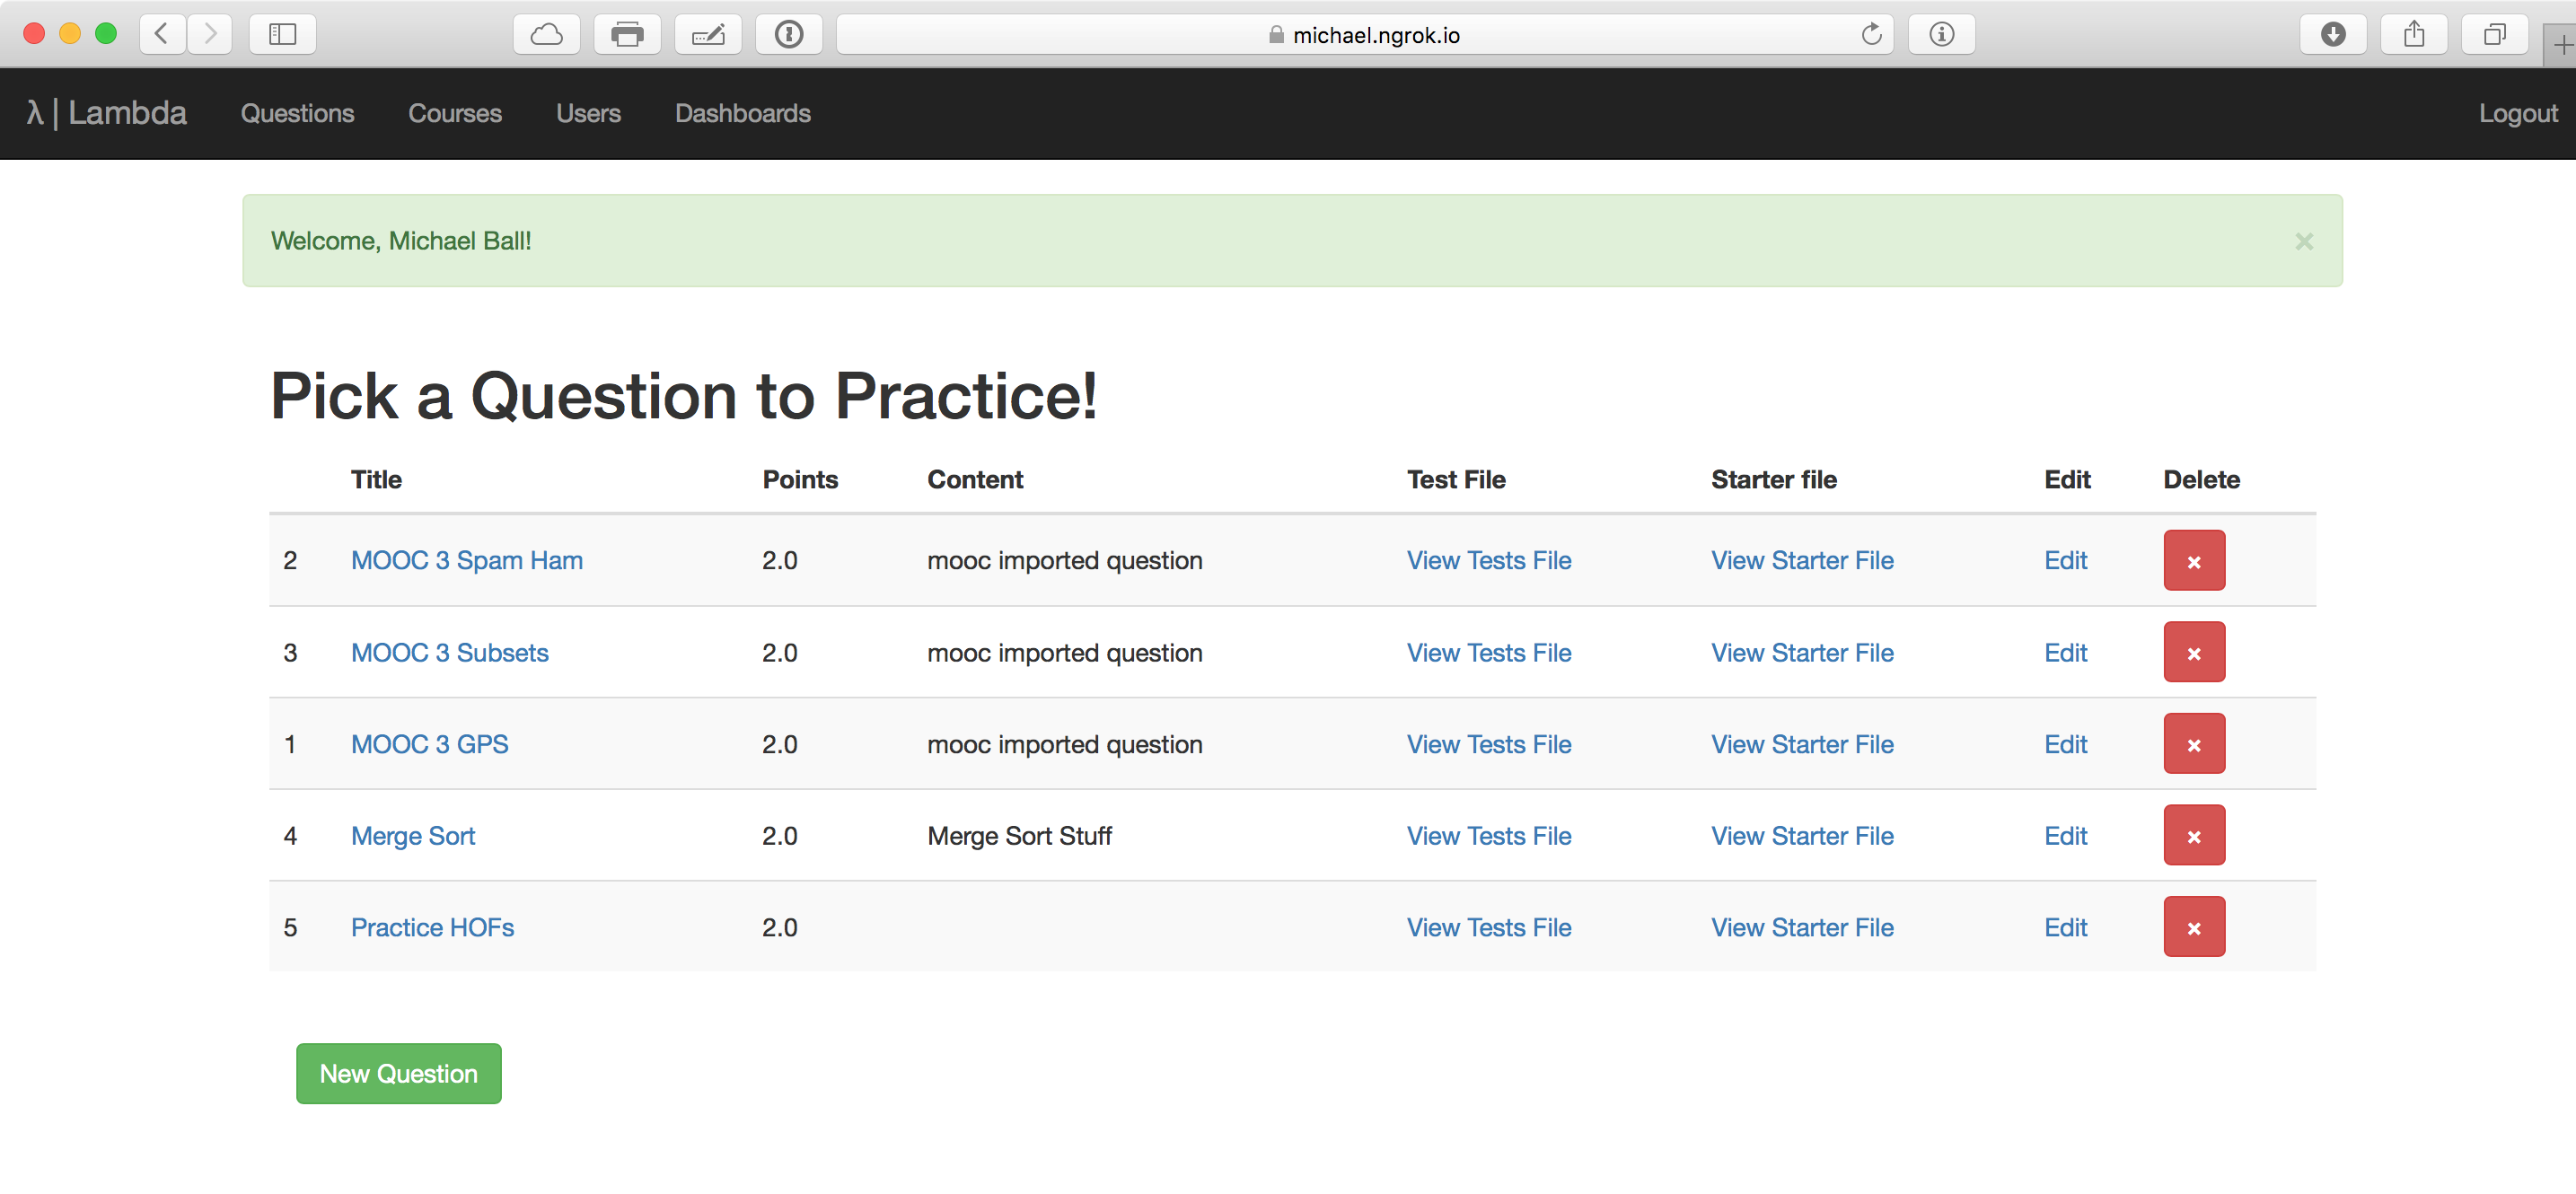
These features are:
- Creating / Editing Questions - A question contains a test file, a points value, and a starter file.
- Creating / Editing Courses - Courses describe connections to the LMS. Each course has a key and some policy settings (figure 6).
- Creating / Editing Admin Dashboards - Admin dashboards provide the status of student performance. This initial version is based entirely on custom SQL queries, but they can be powerful. These dashboards were a significant benefit in doing analysis for this report and were shared with TAs during the course (figure 7).


1.7.2 The Snap! Interface
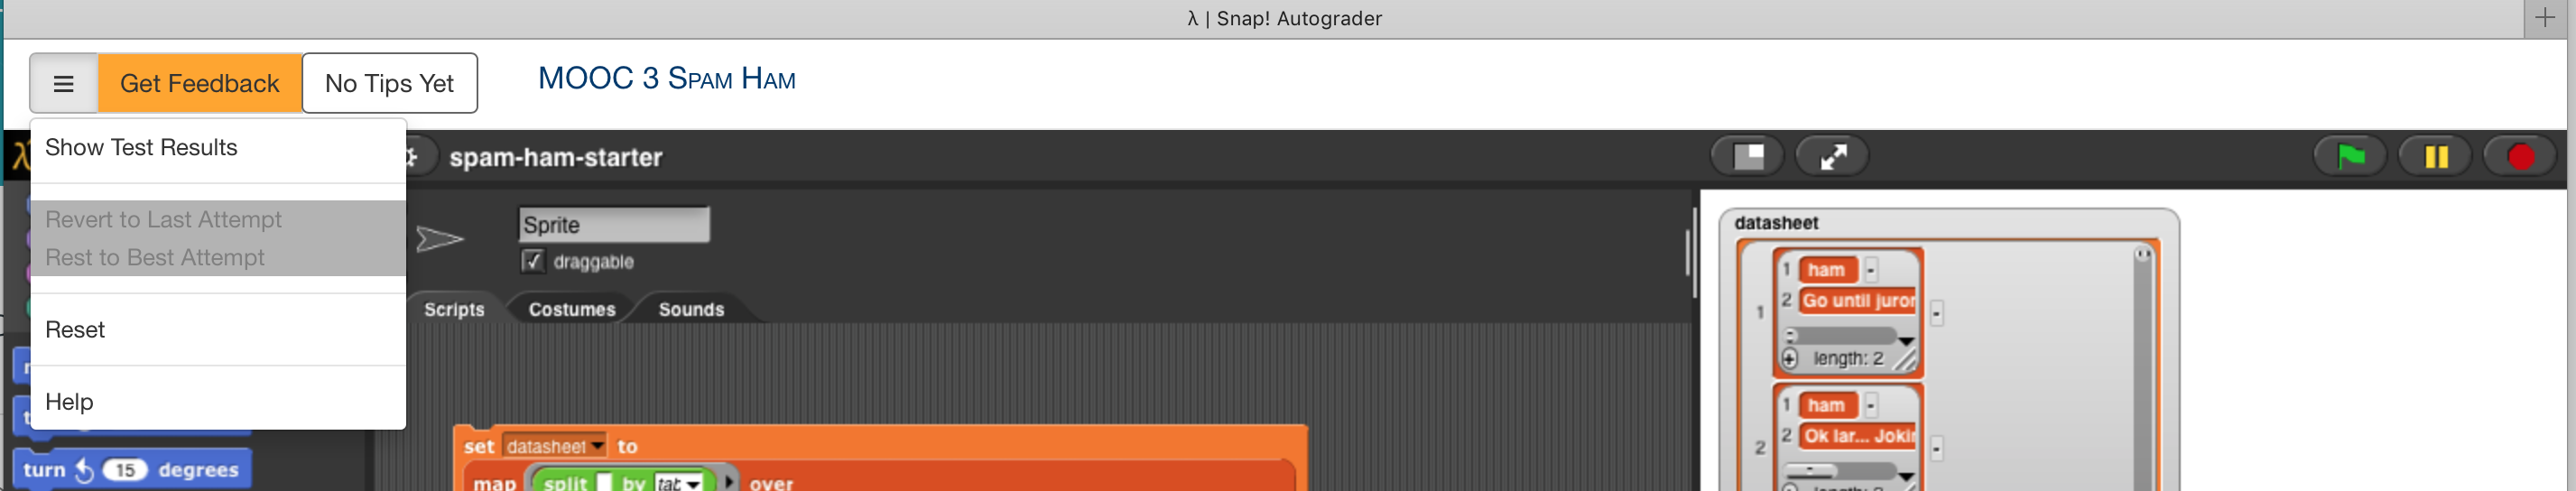
The autograder augments the Snap! interface with a few basic tools. The initial version of the autograder included a button and "hamburger" menu, that were designed to appear integrated into Snap!. However, the apparent seamlessness was actually more confusing because the controls never fit within the rest of Snap!.

The updated version more clearly separates the autograder controls from Snap!, and gives us more room to expand functionality in the future. A problem title will always be displayed in the Snap! interface (compared to outside the window in the edX version), which was a small but important change because the new setup allows for displaying Snap! in a separate tab from the question instructions.
Both interfaces have the following features for students:
- The "Get Feedback" button runs a set of autograder tests on the code, which are presented when tests are complete.
- The color of the status bar (the button in the edX version) changes color based on the question's state:
- Green: All tests are passing
- Orange: The student has modified their code and tests should be re-run.
- Red: At least one test is failing.
- The color of the status bar (the button in the edX version) changes color based on the question's state:
- Restore Best Submission
- Restore Last Submission
- These two features encourage students to experiment and re-write code without any fear that they might hurt their scores or lose work. Every time the "Get Feedback" button is clicked, a submission is recorded.
- Reset
- Restores the current Snap! project to the state of the starter file.
- Help
- Displays a set of tool tips over autograder-specific elements.
- Show Previous Results
- This is a new option which will present the feedback of the previous tests without re-running them. This allows students to review mistakes, and should discourage "autograder-driven development".


The two screenshots in Figures 10 and 11 show two different versions of the autograder presenting feedback. Students see passing tests on top in green and failing tests on the bottom in red. Each section has details about the particular test cases, and the bold headings can contain tips or guidance for students.